Meta
Let’s Talk.
Want to grow fast? Let’s talk.

"*" indicates required fields

Apply Now.
Please apply below.

"*" indicates required fields

Hidden
Drop files here or
Max. file size: 300 MB.
    All
    Paid Social
    Paid Media
    Ad Creative
    Meta

    When You *Actually* Need To Make Changes To Your Facebook Ads.

    Nov 05, 2020 |
    Written by:
    Tom Lambert

    A problem that a lot of Facebook marketers experience is understanding when they actually need to make a change to their best performing campaigns or ad sets.


    This is important because in order to get the best out of the algorithm, you need to let it learn which people respond best to your ads and ultimately purchase.


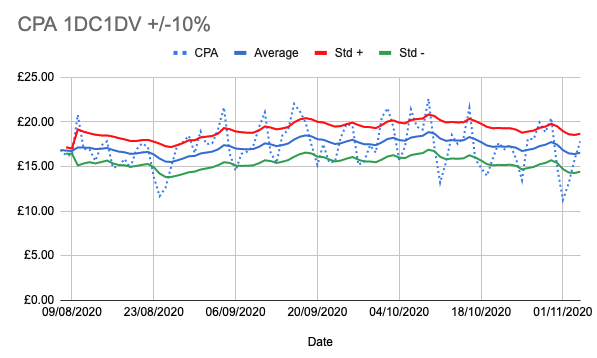
    Most marketers rely on gut feel, informed by changes to CPM, CTR and conversion rates when optimising, but we thought it would be good to have a tool that can help you sense check your decision making so you can avoid second guessing things.


    So the the main question we want an answer to is:

    “Is the variance in performance actually significant enough to warrant a change, pushing our campaigns back into learning?”


    The solution we came up with looks like this:

    CPA graph

    It’s not the prettiest thing in the world, but what it does do is clearly show when performance is significantly better or worse than the average for the period.

    The chart takes your 1 day click 1 day view cost per purchase (or other event), calculates a moving average and gives you 10% “guardrails” either side, helping you put fluctuations in performance in a bit more context.

    *Geek alert: skip if you don’t care*

    What is an exponentially weighted moving average?

    This chart uses an exponentially weighted moving average to give you your CPA trend line (in blue).

    Compared to a standard moving average, it gives more weight to recent events, meaning it reacts much faster to recent changes in the CPA.

    This makes it more suitable for this than a regular moving average, which simply totals your CPA and divides it by the number of days, which would be too slow to respond to significant system changes in the past couple of days.

    This chart is then also combined with a handy “ALERT” notification in the sheet:

    Standard deviation chart

    As was quickly pointed out by members of the team, this is by no means a chart that gives you crazy insights into how you should optimise your campaigns, it is simply showing us when performance is consistently higher or lower than average, helping you see the bigger picture.

    The key to getting the best out of it is to use it as a way of sense checking your “gut feel”.

    If you have had an alert 2-3 days in a row you should probably be looking to change something, unless you are aware of seasonal factors or you’ve just made a significant change to budget or optimisation which might have caused the swing.

    As we are incredibly generous, we’ve mocked up a template (using dummy numbers) for anyone to use here in this Google sheet.

    All you need to do is:

    1. Make a copy
  • Insert your 1DC1DV CPA in the column and you’re all set.
  • We use Supermetrics to populate the data every morning automatically, but you can easily just export the data from Ads Manager too.

    Do you actually find this useful? Do you have a better way of guarding against second guessing the algorithm? How do you decide when to make significant changes to your campaigns?

    Let me know on Linkedin or in an email (tom@bark.london).


    Shout out to Mark Wagner at Soultime for his help on this one, he is by far the best statistician I know and is doing some great things in the app world. Highly recommend you check them out.

    Join the BARK newsletter.

    Join 1,000+ other DTC brands and receive a short email every week or two to give you insights, ideas and actions you can take to grow your business.

    "*" indicates required fields